


BIND has two mechanisms for publishing usage statistics; the static 'named.stats' file and the statistics channel, which can be read over the network as XML or JSON-formatted data, provided over HTTP.
Using the named.stats file
The command rndc stats will trigger a BIND 9 server to write a file with internal statistics to the file named.stats in the BIND 9 server's home directory. The directory and the name of the file can be changed in the BIND 9 configuration file named.conf with the statistics-file directive inside the options { block.
To obtain statistics on zones, this need to be enabled in the BIND 9 configuration file named.confusing the following statement:
options {
[...]
zone-statistics yes;
};
It is also possible to enable zone statistics for selected zones only by putting the same statement inside the zone block in the configuration:
zone "example.org" in {
type primary;
file "primary/example.org";
zone-statistics yes;
};
Many popular monitoring tools offer modules to use the data in the named.stats file including:
Challenges with named.stats
Although the traditional statistics file is easy to use, there are a few challenges with this method.
- BIND 9 will always append new statistics to the end of the statistics file, so unless checked it will grow continuously. Purge the file from time to time, or make backups and delete the contents. Monitoring plugins usually read the file from the beginning to find the latest information.
- The
named.statsfile contains human readable data, which needs to be parsed by a tool. - The contents of
named.statscan change with new BIND 9 releases. - Monitoring plugins might fail when the parser is not well written.
BIND 9 HTTP statistics channel
The BIND 9 statistics can also be retrieved from a running BIND 9 server via the HTTP protocol. BIND 9 has a tiny built-in web-server, which provides the statistics data in XML or JSON format.
It is disabled by default but can be enabled easily with a single line of configuration. e.g.
statistics-channels { inet 127.0.0.1 port 8080 ; };
The address and port it listens on can be chosen. It is also possible - and highly recommended - to specify a list of source addresses that are permitted to access the channel.
BIND 9 statistics channel dependencies
In order to provide the statistics data over XML, BIND 9 must be compiled with libxml2 support. For JSON output, the BIND 9 server needs to be compiled with support for json-c
The ISC BIND 9 packages contain the XML and JSON functions.
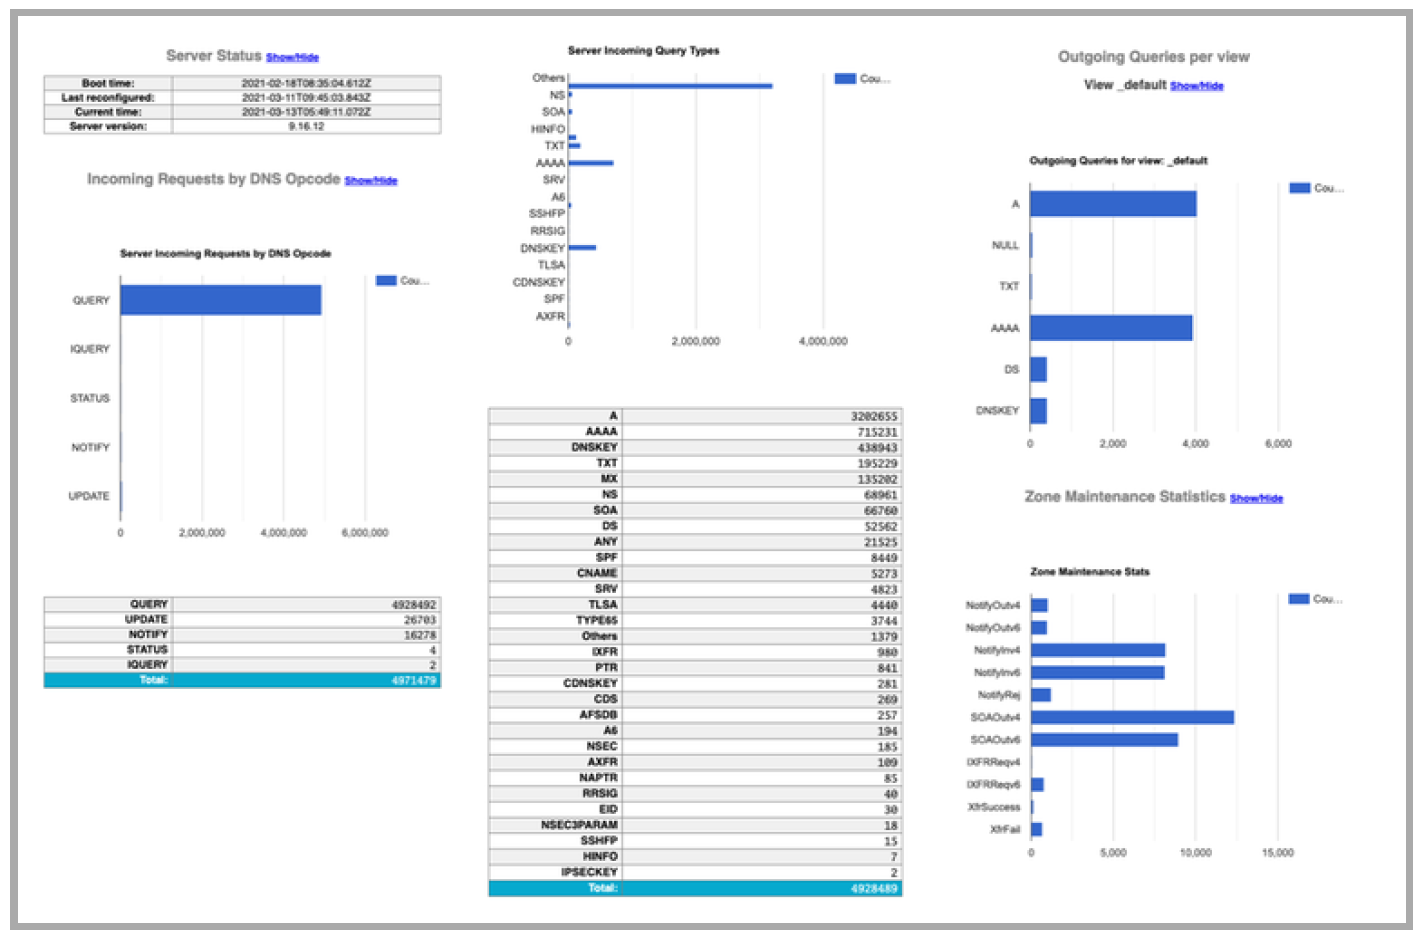
Example Statistics formatted with the XML style sheet
JSON (JavaScript Object Notation) is an open standard file format that uses human-readable text. JSON is faster to parse than XML and some (many?) people find JSON easier to work with than XML.
Security recommendations for the statistics channel
It reveals internal information that can be used to attack the DNS server and it increases the application 'surface' for attackers.
- Bind the statistics channel only to internal management networks.
- Protect the BIND 9 statistics channel with a reverse web proxy such as NGINX, Caddy, or OpenBSD httpd, with basic authentication or TLS client certificate authentication.
BIND 9 statistics channel vs. "named.stats"
The statistics channel has some benefits compared to the older named.stats statistics file method.
- The statistics can be read over the network.
- The statistics come in structured data (XML or JSON) that is more easily parse-able by software (more robust monitoring).
- The format of the statistics data is versioned.
- A change in the statistics format will not break existing tools.
Preparing to troubleshoot a BIND DNS server
When something goes wrong in a DNS server there are several major categories of data you want to examine. These include; memory usage and whether your cache is over full, cache contents and their age, query and response statistics, including response types, and the most basic, packets in and out. For most of these, you need some historical data so you can see when your current measurements are anomalous.
1. Cache capacity.
It's quite useful to know something about cache capacity and limits and whether or not you've reached them.
You are looking for:
HeapMemInUse - "cache heap memory in use"
TreeMemInUse - "cache tree memory in use"
HeapMemMax - "cache heap highest memory in use"
TreeMemMax - "cache tree highest memory in use"
The 'Max' values are a high water mark (content will increase and decrease - this is the highest it has reached so far). The 'InUse' values are how much is in use now.
You might also be interested in:
DeleteLRU - "cache records deleted due to memory exhaustion"
LRU stands for Least Recently Used. If this counter is zero, then max-cache-size has not ever been reached.
2. Cache content and cache record expiration.
RRs expire 'passively' - that is, they hold a timestamp that indicates whether or not they're still valid. Cleanup takes place periodically, but what this means is that there are counters of RRs divided into different RTYPEs. These counters are always going to be a bit out of date, because a 'passive' expiry isn't going to update a counter, plus expired content isn't remove immediately.
It can very interesting to know what you have in cache - particularly if there's a significant change that diverges from normal (that is, 'normal for this server). So for that reason, we recommend keeping track of the counts of the different RRsets - you can find these in the rdatasets block.
3. Queries and Responses.
It is useful to track the counters of what happened with the queries that named received. Those are in the Name Server Statistics section. There's some overlap between some of them (for example, a query could cause recursion, but then result in a SERVFAIL).
Establishing what's 'normal' so that you can recognise exceptions is a good way to operate.
These counters are available in the Resolver Statistics section. At the least granularity you have:
Queryv4 - "IPv4 queries sent"
Queryv6 - "IPv6 queries sent"
and
Responsev4 - "IPv4 responses received"
Responsev6 - "IPv6 responses received"
But you can also track what you got back; referrals, FORMERRs, timeouts etc, as well as look at what the pattern of RTTs (Round Trip Time).
For most of these, including the RTT buckets, pull the stats and intervals and then by subtraction, monitor what happened over the interval period. That way you should be able to spot any unusual spikes such as timeouts or FORMERRs which might be a clue that you're receiving unusual client query traffic, or that something bad has happened out on the Internet.
4. Inbound and outbound packets.
You can count these from BIND, but we recommend also monitoring them from the server itself. Extra points for being able to track both sets in the same graph if you need to.
Particularly important with the inbound/outbound statistics on a resolver, is being able to distinguish between inbounds/outbounds that are client queries, and inbounds/outbounds that are related to recursion.
Recommended metrics to monitor on a recursive DNS server (DNS resolver)
- Memory consumption of the BIND 9 process (Cache Memory / Memory fragmentation)
- CPU load (load per CPU core)
- Network card utilization
- Number of clients per time unit
- Number of concurrent clients over UDP
- Number of concurrent clients over TCP
- Rate of incoming TCP queries vs. UDP queries (Clients to resolver)
- Rate of outgoing TCP queries vs. UDP queries (Resolver to authoritative server)
- Number of outgoing SERVFAIL responses (indicator
for DNSSEC validation issues or a server issue) - Latency of DNS answers from outside authoritative server (generic, and from a set of "well known" important domains like google.com, facebook.com etc)
- Rate of FORMERR responses towards clients (indicator for network issues, failing CPE updates, malware infected clients)
Recommended metrics to monitor for an authoritative BIND 9 DNS server
- Number of queries per time unit (load)
- Number of UDP and TCP queries
- Size of DNS answers (-> EDNS0 / Fragmentation)
- Percentage of truncated answers
- NXDOMAIN answers per time unit (indicator for issues with the zone content or DDoS attacks -> random subdomain attack)
- SERVFAIL answers per time unit (indicator for server mis-configuration or DNSSEC issues)
- Network card utilization
- CPU utilization (DNSSEC + NSEC3)
- Zone-Transfer per time unit / Errors with Zone-Transfer
- Response-Rate Limiting per client IP
- DNSSEC signing (and automated key rollover) events and errors
- SOA serial numbers on primary/secondary zones,
- Zone update latency
- For dynamic zones: update per time unit
Note: This article is based on a March, 2021 presentation by Carsten Strotmann on monitoring BIND 9, along with other material. The recording is available in ISC's YouTube channel.