Exporting statistics to Prometheus
- 17 Mar 2021
- 1 Minute to read
-
Contributors


-
Print
-
DarkLight
-
PDF
Exporting statistics to Prometheus
- Updated on 17 Mar 2021
- 1 Minute to read
-
Contributors
-
Print
-
DarkLight
-
PDF
Article Summary
Share feedback
Thanks for sharing your feedback!
Stork Overview
ISC is developing a new open source monitoring application, called Stork. Stork consists of a Stork User Agent, which runs on the BIND9 or Kea application host, and a server, which provides a graphical web monitoring dashboard. The dashboard is focused on Kea usage currently, and is not recommended for BIND users.
STAG as a BIND Prometheus Exporter
The Stork User Agent (STAG) can be used without the Stork server to export statistics from BIND to a Prometheus time-series database, for visualization in Grafana charts.
STAG is not distributed with BIND. It can be compiled from sources (available from the ISC web site) or installed directly from the ISC repository of packages for popular operating systems on Cloudsmith.
Deploying the Stork User Agent
STAG is deployed on each BIND server. See the Stork Administrative Reference Manual and STAG man pages for details on the the (very few) settings required to configure the relationship between Prometheus and the STAG.
Requirements
named must be built with json-c and the statistics-channel must be configured. It is recommended to set zone-statistics to full.
STAG will look for the named process and parse the configuration file (named -c ...). If the command parameters does not include -c STAG will default to /etc/bind/named.conf.
Included Grafana Charts
The Stork distribution includes a Grafana template for BIND, which lays out a series of useful charts, covering Platform Resource Usage, Queries, Cache and Resolver statistics. These are designed to be helpful for BIND resolver operators. Grafana is highly customizable, and it is possible to edit and customize these charts, or add others.
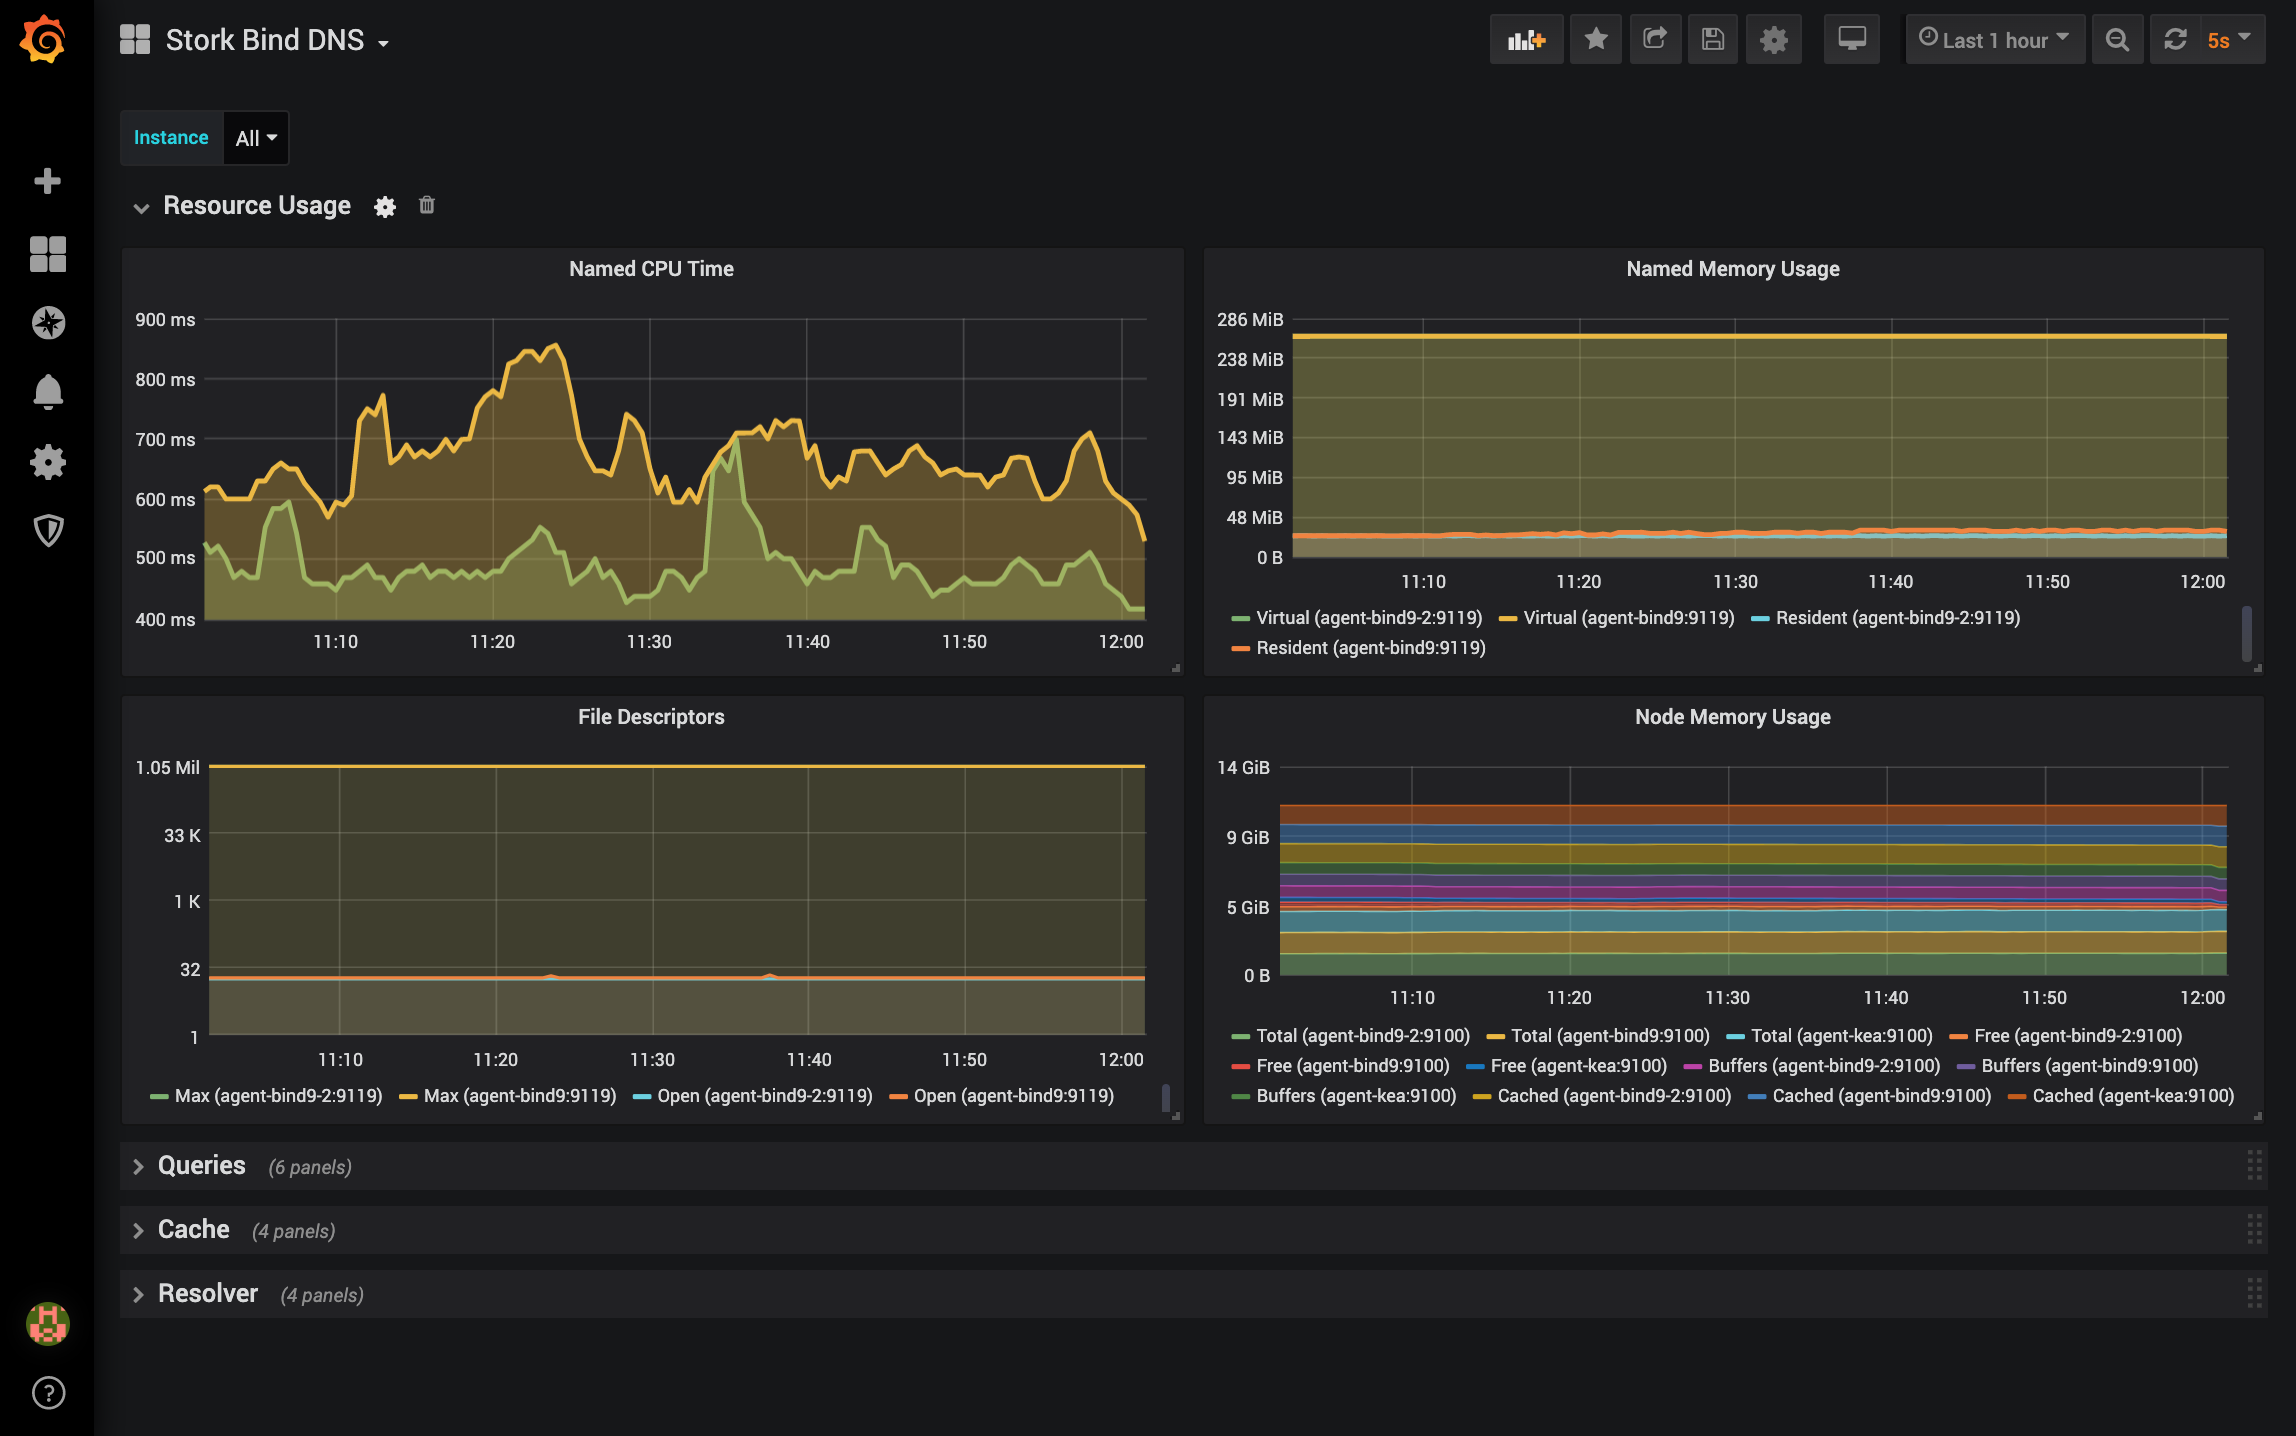
Resource Usage
Because the exporter is not in BIND itself, but on the host, it is also able to export some load information about the platform that is helpful to view in context with query loads. Data shown here includes named CPU and memory utilization, platform memory utilization and file descriptors.
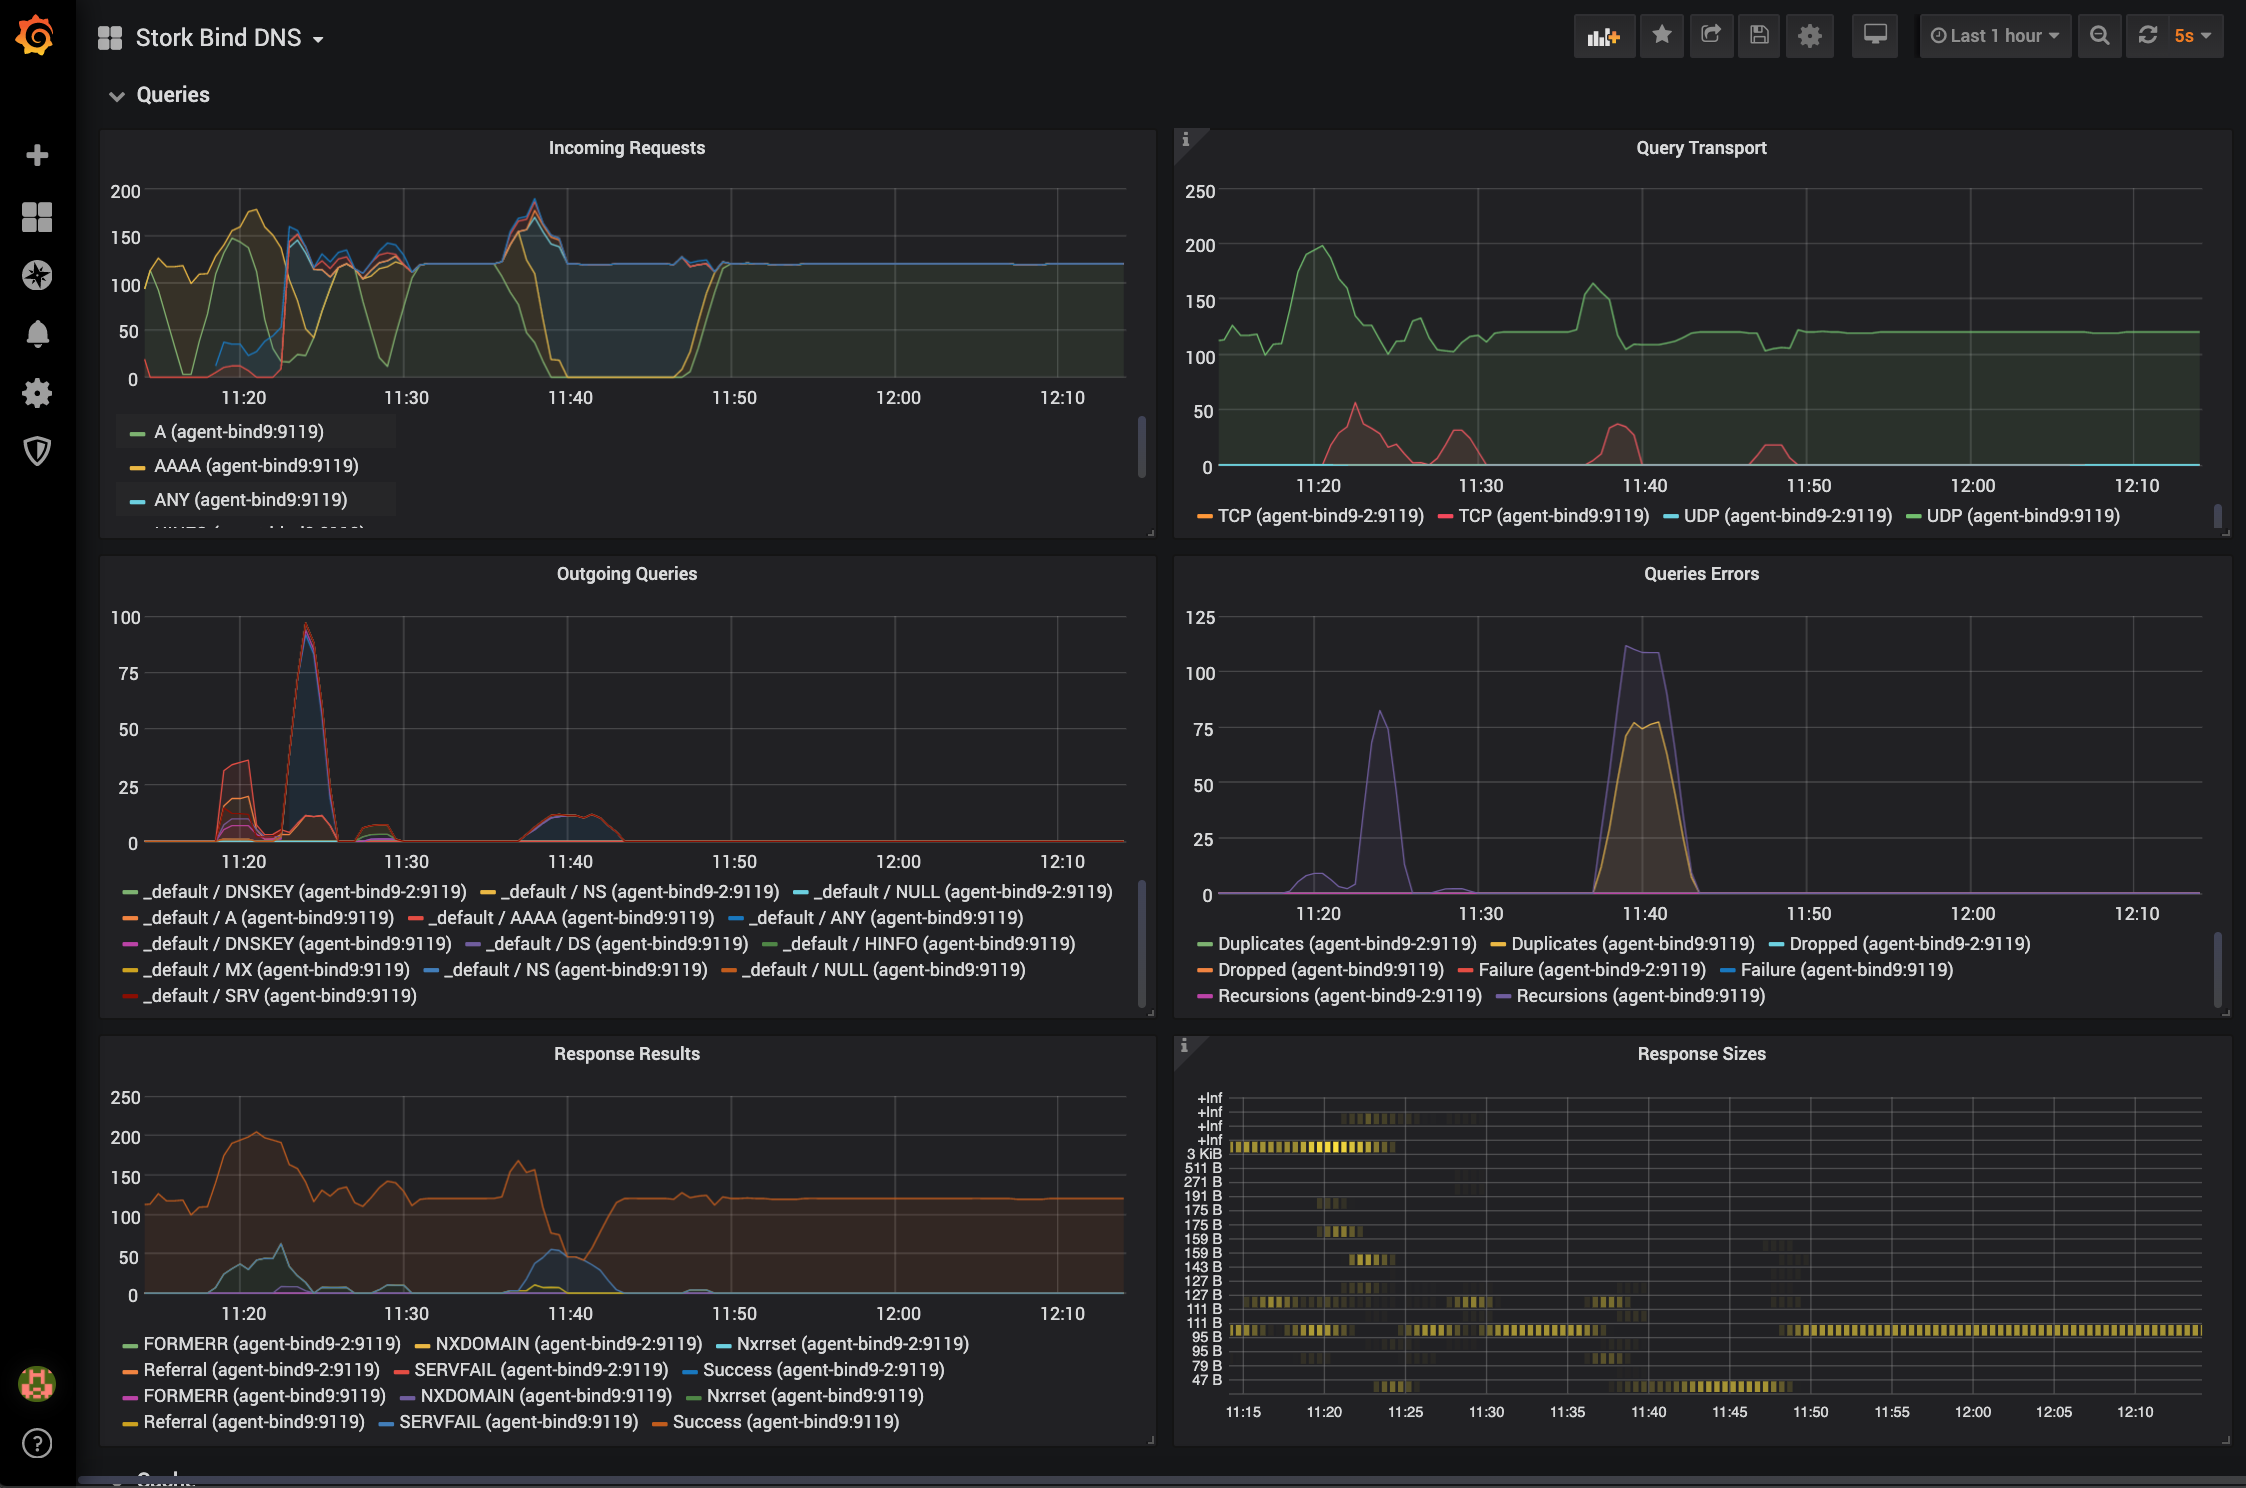
Query Details
This section shows incoming requests and outgoing queries by record type, query errors by error type and responses by response code, and a breakdown of queries by transport type (UDP vs TCP).
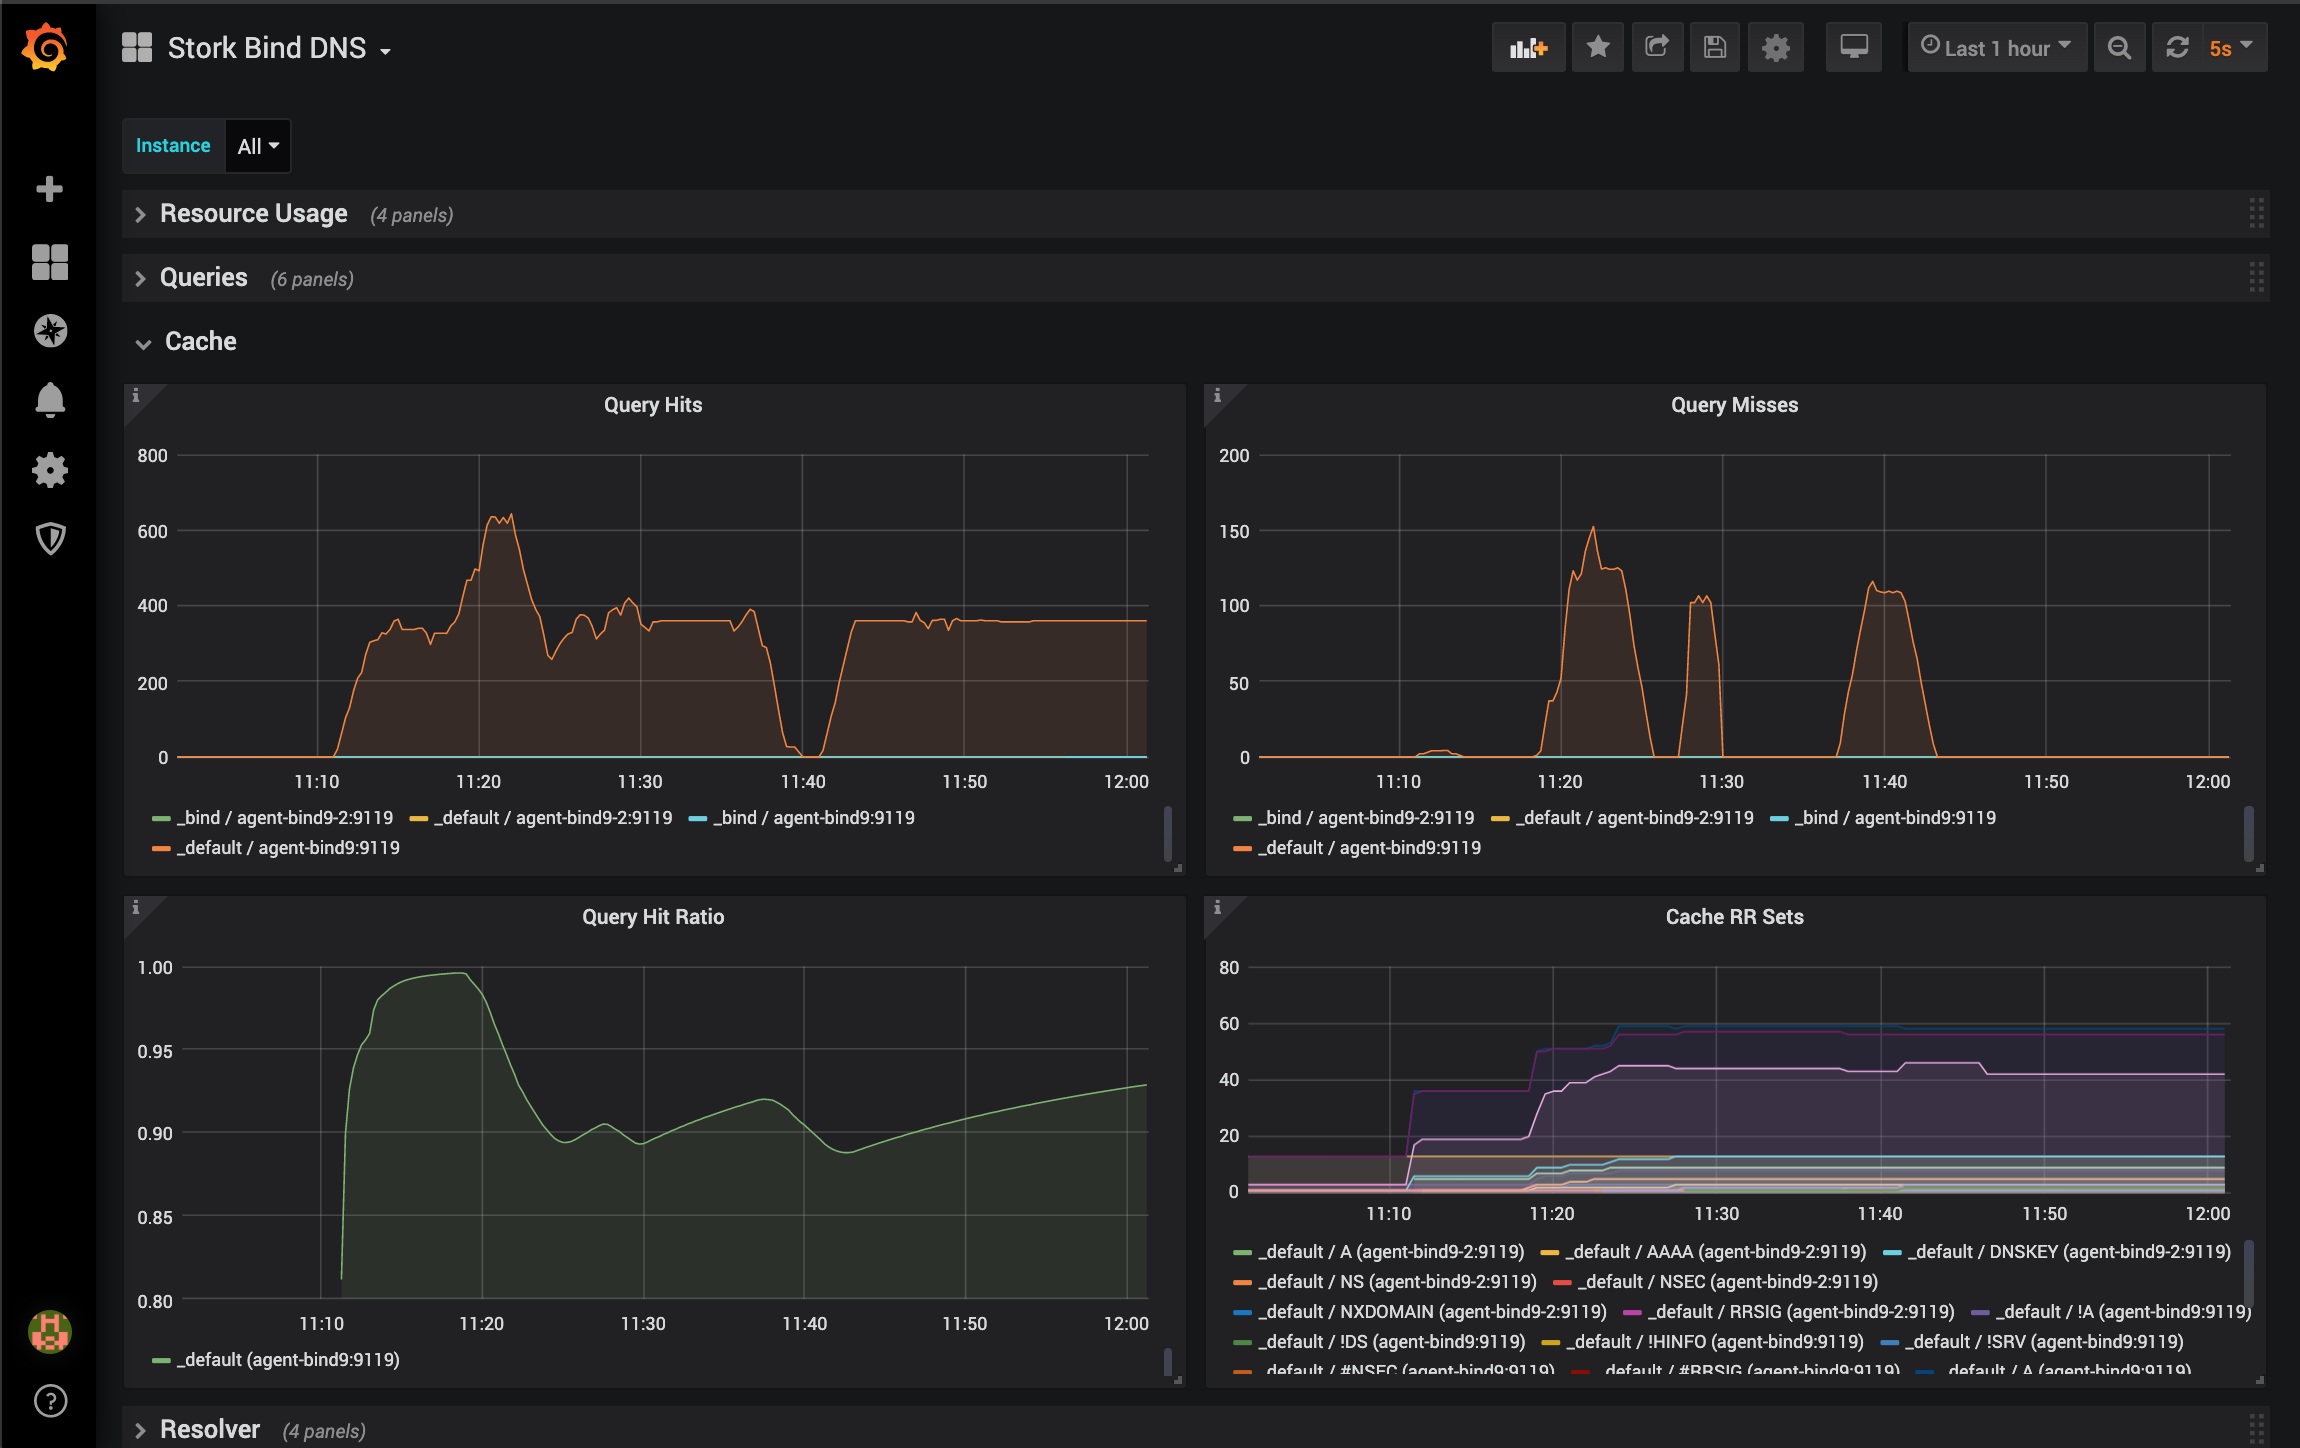
Cache Information
Graphs include cache hits, cache misses, cache hit ratio, and the current cache contents by rrtype.
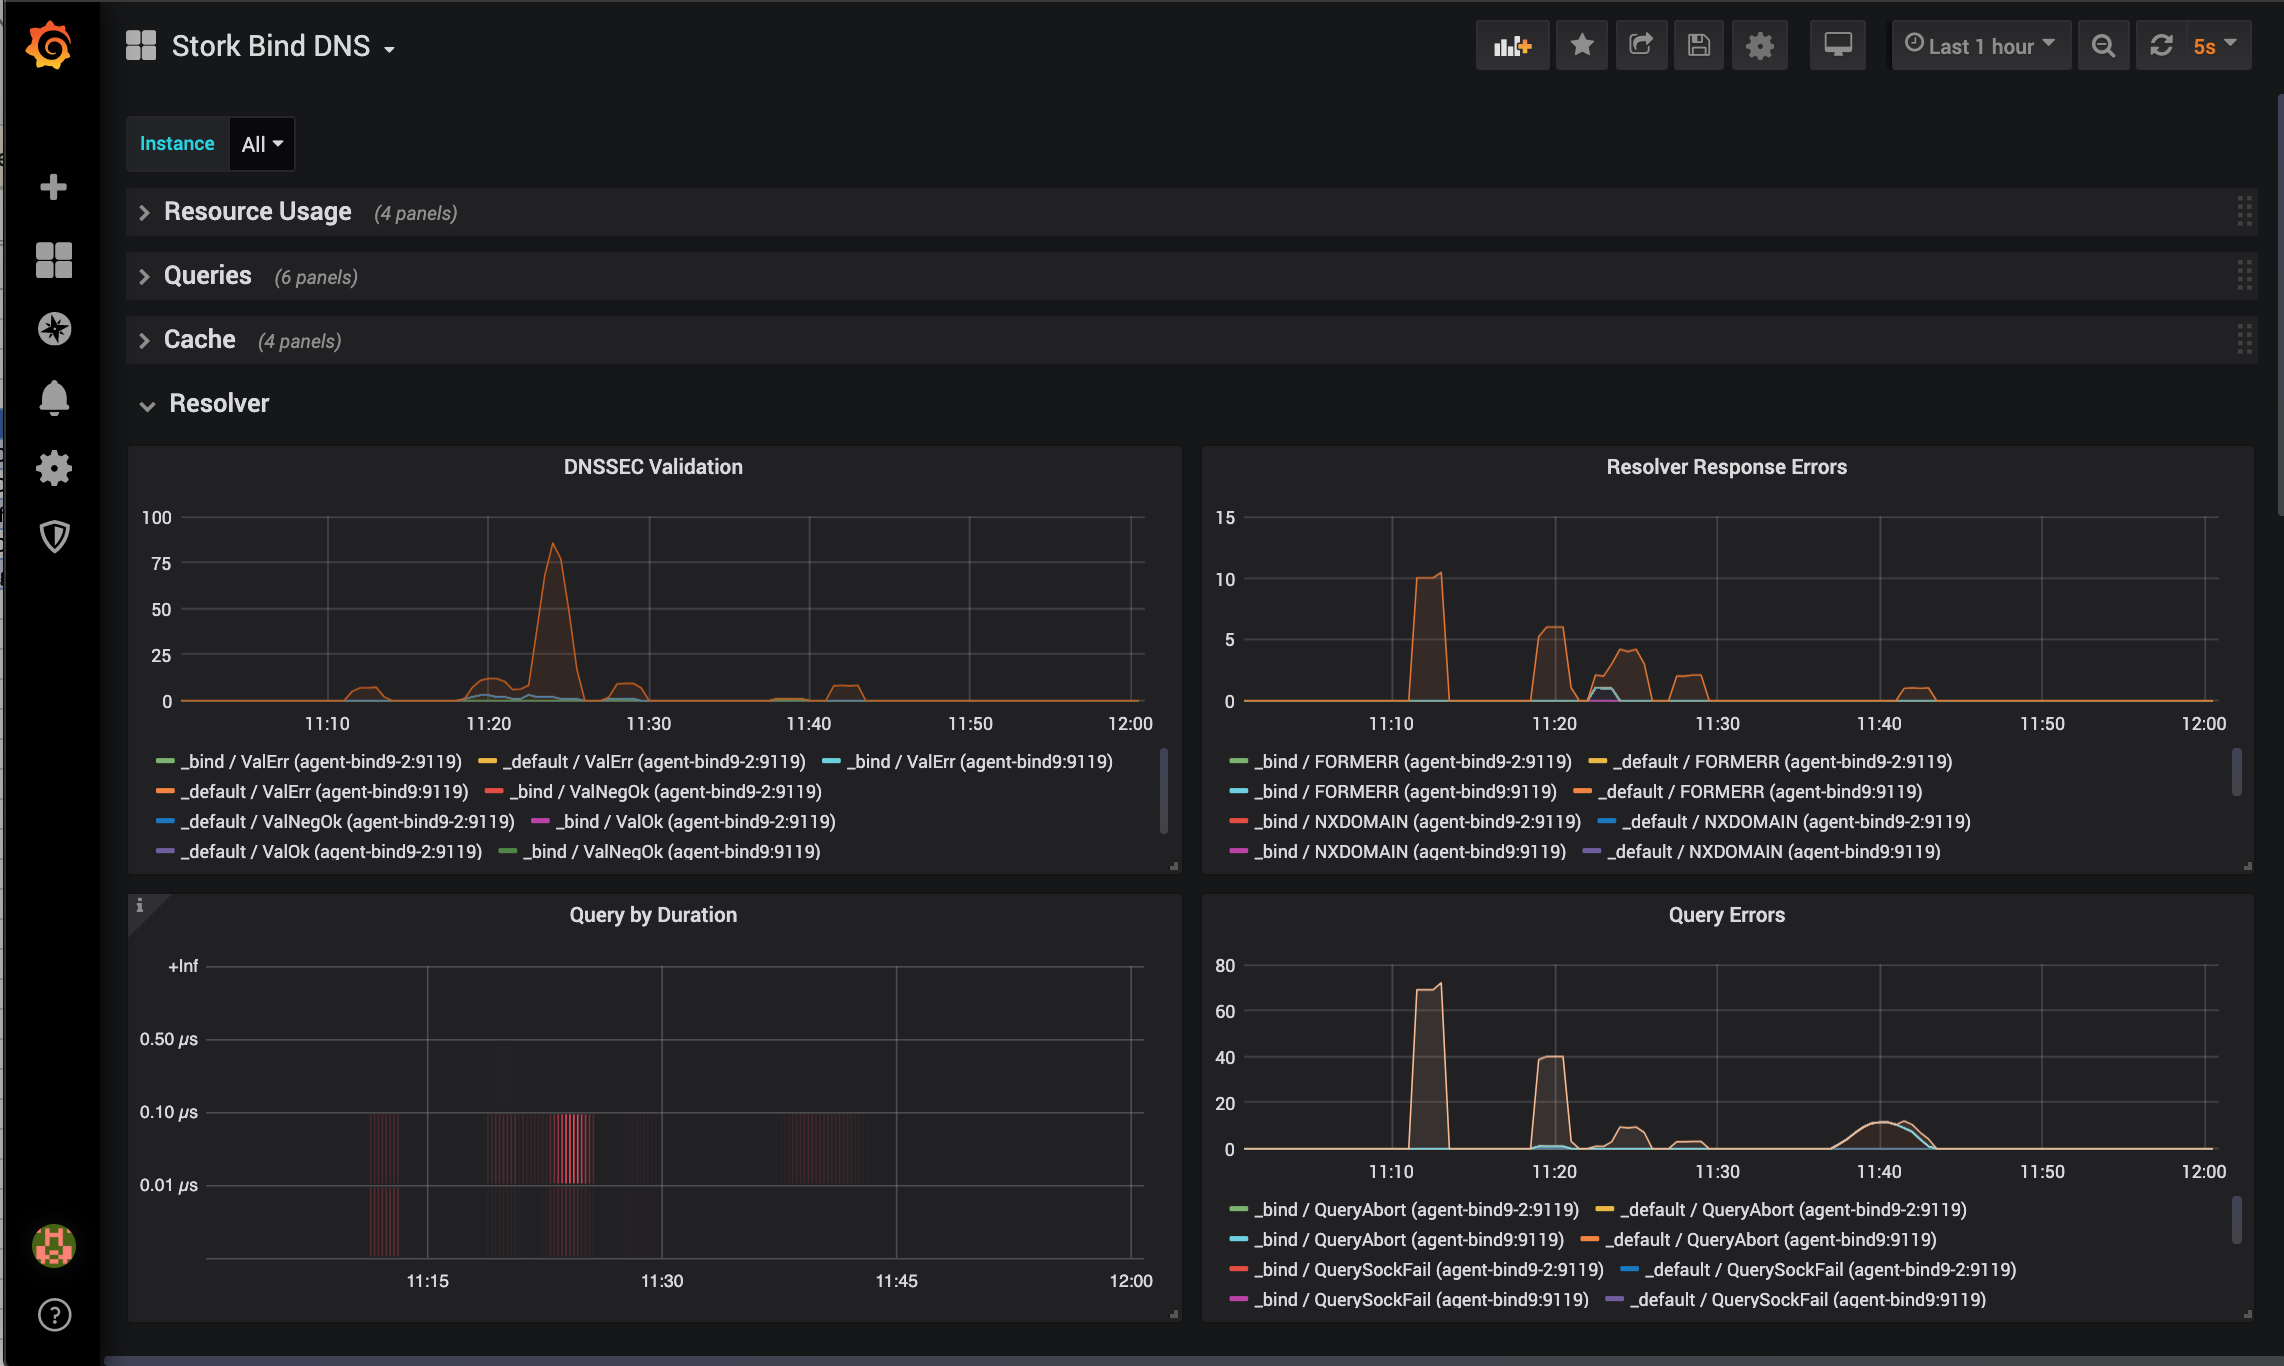
Resolver Details
Graphs include DNSSEC validation rate, Resolver query and response errors by error type, and query duration 'buckets'.